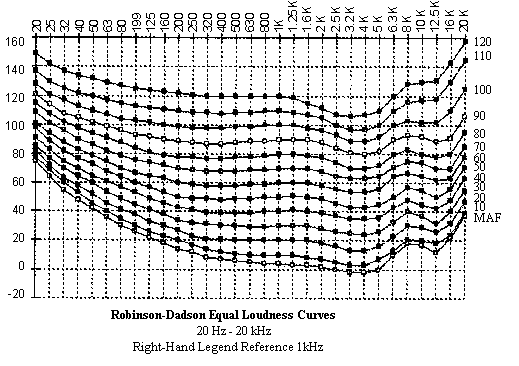
Also known as Fletcher-Munson curves or phon lines. Equal loudness curves are the inverse of frequency response curves and reflect the phenomenon that humans do not hear all frequencies as having equal loudness. In other words, human hearing is not liner in frequency. This is particularly problematic in recording as a mixed master will be perceived differently depending on the playback level. Specifically, there is a marked drop-off in aural sensitivity at low frequencies. At the opposite extreme, humans have high sensitivity to sounds in the 1kHz-8kHz range, with sound again dropping away above 12kHz. Also called equal loudness contours. In the graph below, note that at 60dB SPL, a 1kHz tone is perceived as of equal loudness as a 20Hz tone at over 100dB SPL. At low levels, these differences are accentuated: the same 1kHz tone at 10dB SPL requires 80dB SPL at 20Hz.
